Is Your Reactor Data Arriving Too Late to Make Decisions?
Discover how real-time reactor data helps chemical plants reduce reporting delays, improve batch visibility, monitor process deviations and make faster, data driven production decisions.
In a chemical plant, reactor performance directly affects batch quality, production time, yield and operational efficiency. Parameters such as temperature, pressure, agitation speed and reaction time must be monitored carefully to maintain consistent process conditions.
However, many chemical plants still depend on manual logbooks, spreadsheets and shift reports to record reactor information. Operators document readings, supervisors review reports and production managers often receive updates after a shift has ended.
By the time a delay or process deviation appears in a report, valuable time may already have been lost.
Real-time reactor data helps chemical plants move from delayed reporting to better production visibility and data-driven decision-making.
- Why Reactor Data Matters Reactor operations generate important information throughout the production process. This may include:
- Temperature and pressure readings
- Agitator speed and equipment status
- Raw material addition and dosing
- Reaction start and completion times
- Heating and cooling cycles
- Process alarms and deviations
- Batch progress and final yield When this information is recorded consistently, production teams can understand how a batch is progressing and investigate variations more effectively.
The challenge begins when reactor data is scattered across different systems or recorded in formats that are difficult to compare. Teams may know that a batch took longer than expected but identifying the reason can require hours of manual investigation. 2. The Problem With Manual Logbooks and Shift Reports Manual records are important for operational documentation but relying on them alone can limit visibility into reactor performance. Delayed information A process deviation may occur during a shift but reach the production manager only after the shift report is prepared. This delays investigation and decision-making. Incomplete process history When readings are recorded only at specific intervals, short-term fluctuations or events between observations may be missed. Inconsistent reporting Different operators may use different formats, terminology or levels of detail. Comparing information across shifts and batches becomes difficult. Time consuming analysis Engineers may need to review multiple logbooks, spreadsheets, batch records and laboratory reports to understand why a batch performed differently. Limited visibility across departments Production, quality, maintenance and management may all need reactor data but each team may access a different part of the information.
Without connected data, developing a complete picture of reactor performance becomes challenging. 3. What Is Real Time Reactor Data? Real-time reactor data makes relevant process information available as it is generated or with minimal delay, instead of relying entirely on reports prepared after an event or shift.
Depending on the plant's systems, this information may come from:
- PLCs and Distributed Control Systems (DCS)
- SCADA platforms
- Temperature, pressure and flow sensors
- Manufacturing Execution Systems (MES)
- Laboratory Information Management Systems (LIMS)
- ERP and batch management systems
- Equipment monitoring and maintenance platforms Each system serves a different purpose. The objective is to connect relevant information so authorized users can understand reactor status, batch progress and historical performance without manually collecting data from multiple sources.
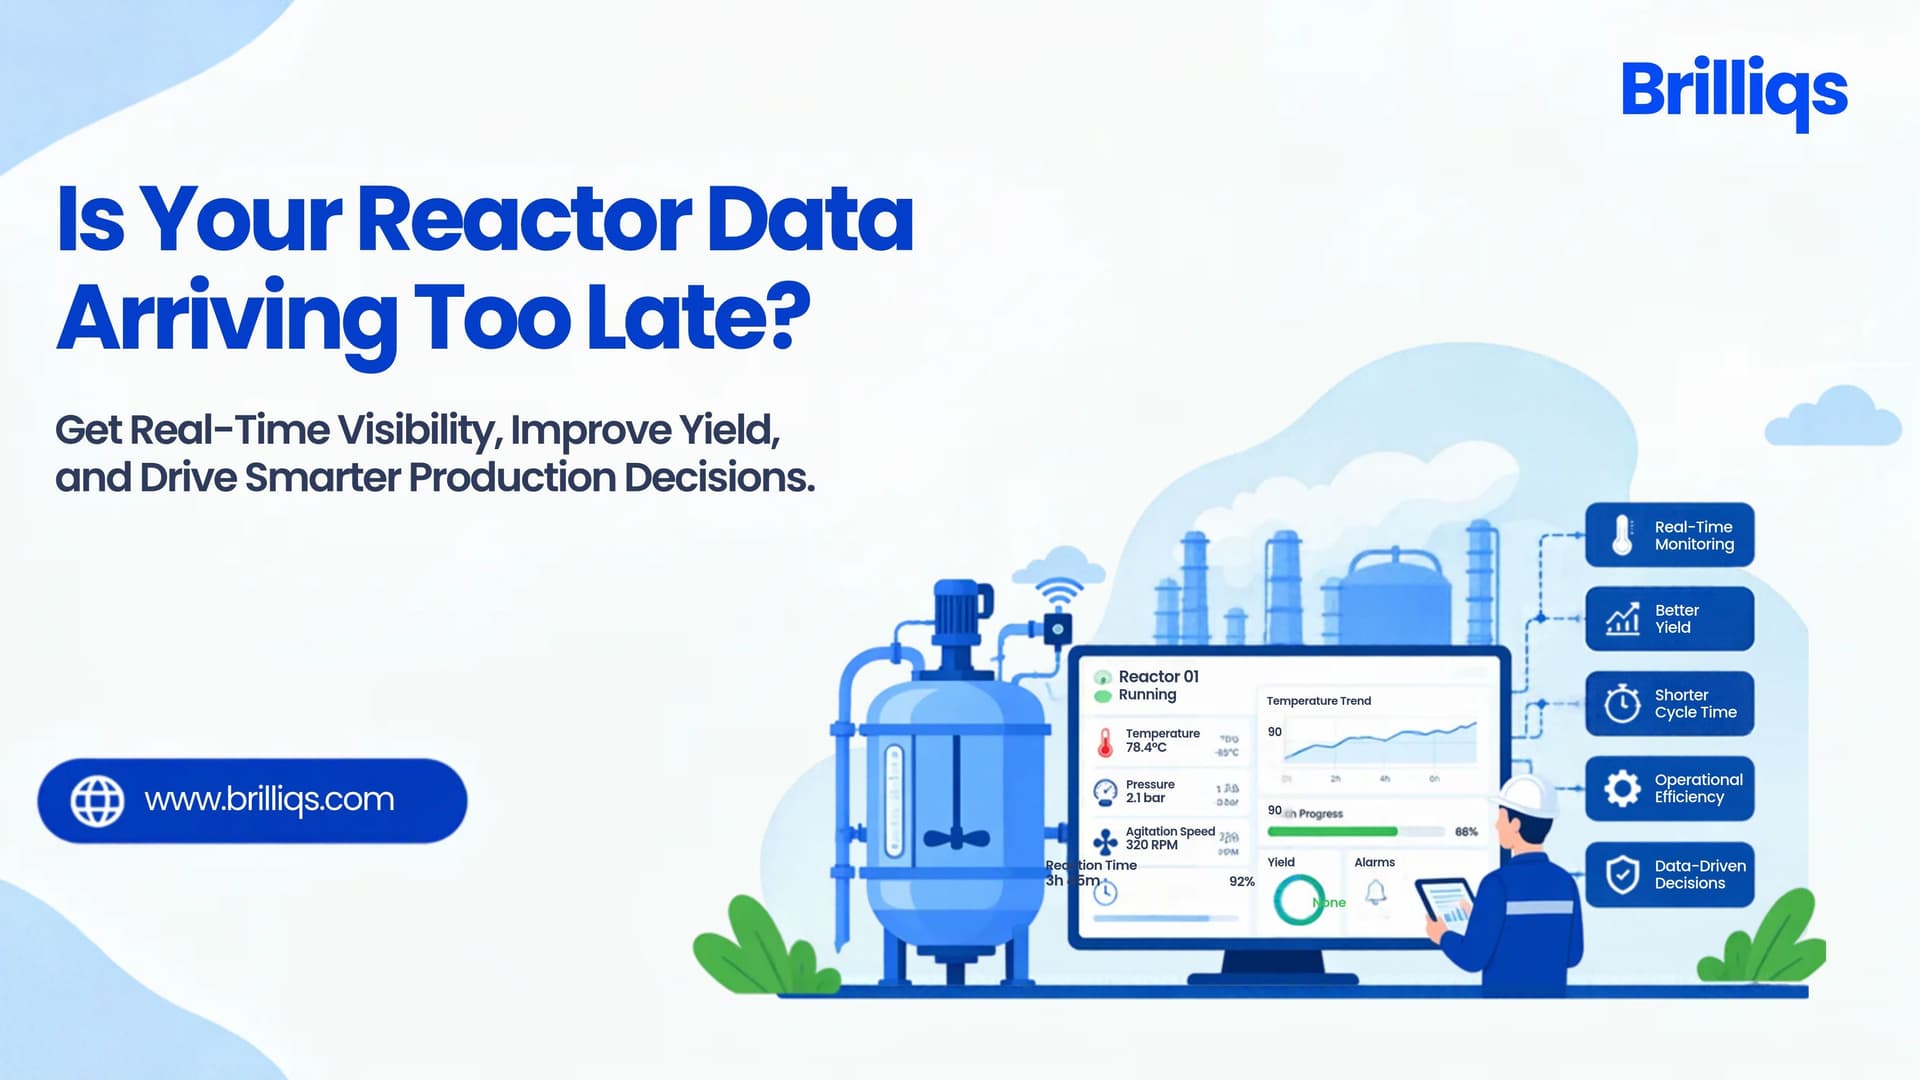
For example, a reactor monitoring dashboard could display current temperature, operating limits, batch stage, elapsed reaction time and relevant alarms in one view.
The goal is not simply to collect more data. It is to make the right information available to the right people at the right time. 4. What Changes With Real Time Reactor Monitoring? Connecting reactor data can improve production visibility and support more timely investigations. Identify process deviations sooner When process readings are available alongside defined operating limits, operators can identify unusual conditions earlier and investigate them according to approved procedures.
Dashboards support visibility but should not replace validated control systems, safety interlocks or established operating procedures. Track batch progress Production managers can review batch stages, elapsed time and completion status to identify delays and understand which reactors require attention. Improve shift handovers Structured digital records help incoming operators understand ongoing batches, previous deviations, relevant alarms and outstanding actions. Compare batch performance Consistent historical data allows engineers to compare batches and investigate differences in cycle time, operating conditions, yield and quality results.
These comparisons provide a stronger starting point for process improvement and root cause investigations. 5. Connecting Reactor Data With Batch Quality Reactor readings alone do not explain every quality or yield variation. Raw material characteristics, process conditions, equipment performance and laboratory results can all influence the final outcome.
To investigate batch performance, teams may need to connect:
- Raw material lots and consumption records
- Reactor operating history
- Batch start and completion timestamps
- Process deviations and alarms
- Laboratory test results
- Final yield and quality status
- Rework and rejection records When these records share consistent batch identifiers and timestamps, engineers can investigate relationships between operating conditions and production outcomes more efficiently.
For example, if several batches show lower-than-expected yield, engineers can compare their temperature profiles, reaction durations, raw material lots and equipment histories.
These comparisons do not automatically prove the cause of a problem but they help teams identify patterns and investigate potential contributing factors. 6. Why a Strong Data Foundation Is Essential A dashboard is only as reliable as the data behind it.
In chemical plants, information may be stored across control systems, spreadsheets, production applications and quality platforms. Different equipment names, inconsistent timestamps, missing readings and incompatible formats can make integration difficult.
A reliable data foundation addresses these challenges through:
Data integration: Connecting relevant information from different systems through suitable interfaces and data pipelines.
Data standardization: Aligning equipment identifiers, batch numbers, timestamps, units and process terminology.
Data quality: Identifying missing values, duplicate records and inconsistencies that could affect reporting.
Historical data management: Organizing process records so teams can investigate previous batches and analyze long-term trends.
Data governance: Managing access, security, traceability and retention according to plant requirements.
These capabilities help ensure that reactor dashboards present consistent and useful information.
Explore how Data Engineering helps connect manufacturing systems and transform disconnected plant information into reliable data for better decision making. 7. What Should a Reactor Monitoring Dashboard Include? A practical dashboard should focus on the information required to make operational decisions.
Key indicators may include:
- Current reactor and batch status
- Temperature and pressure trends
- Target operating ranges and deviations
- Reaction duration and batch cycle time
- Equipment interruptions and alarm history
- Batch completion status
- Yield and quality results, when available
- Planned versus actual production time
- Historical batch comparisons Different users may need different views. Operators may require detailed process measurements, while production managers and plant heads may prefer a consolidated view of batch status, delays, exceptions and performance trends.
The dashboard should be designed around operational needs rather than displaying every available measurement on a single screen. 8. How to Move Beyond Manual Reporting Chemical plants can introduce connected reactor monitoring through a phased approach.
Step 1: Identify critical parameters. Work with production, process engineering, quality and maintenance teams to determine which measurements and events matter most.
Step 2: Map existing data sources. Identify where reactor readings, batch records, quality results and equipment information are stored.
Step 3: Standardize identifiers. Establish consistent ways to identify reactors, batches, equipment and material lots across systems.
Step 4: Integrate and validate data. Connect the required information and verify its accuracy against source records.
Step 5: Build a focused dashboard. Start with useful indicators such as batch status, temperature trends, reaction time and process deviations.
Step 6: Review and improve. Compare dashboard information with existing reports, resolve discrepancies and expand monitoring based on operational results.
This approach allows plants to improve visibility without needing to replace every existing system at once. Conclusion: Turn Reactor Data Into Better Decisions Manual logbooks and shift reports continue to play an important role in chemical manufacturing. However, they may not provide the timely visibility required to understand complex reactor operations.
When process readings, batch records, quality results and equipment information remain disconnected, teams spend valuable time collecting and reconciling data.
By integrating reactor information and presenting it through reliable dashboards, chemical plants can improve batch visibility, investigate deviations more effectively, and build a stronger foundation for process optimization.
At Brilliqs, we help businesses connect and organize data from different systems so it becomes more reliable, accessible and useful for decision-making.
Move beyond manual reporting. Build a connected data foundation for clearer reactor visibility and smarter production decisions.