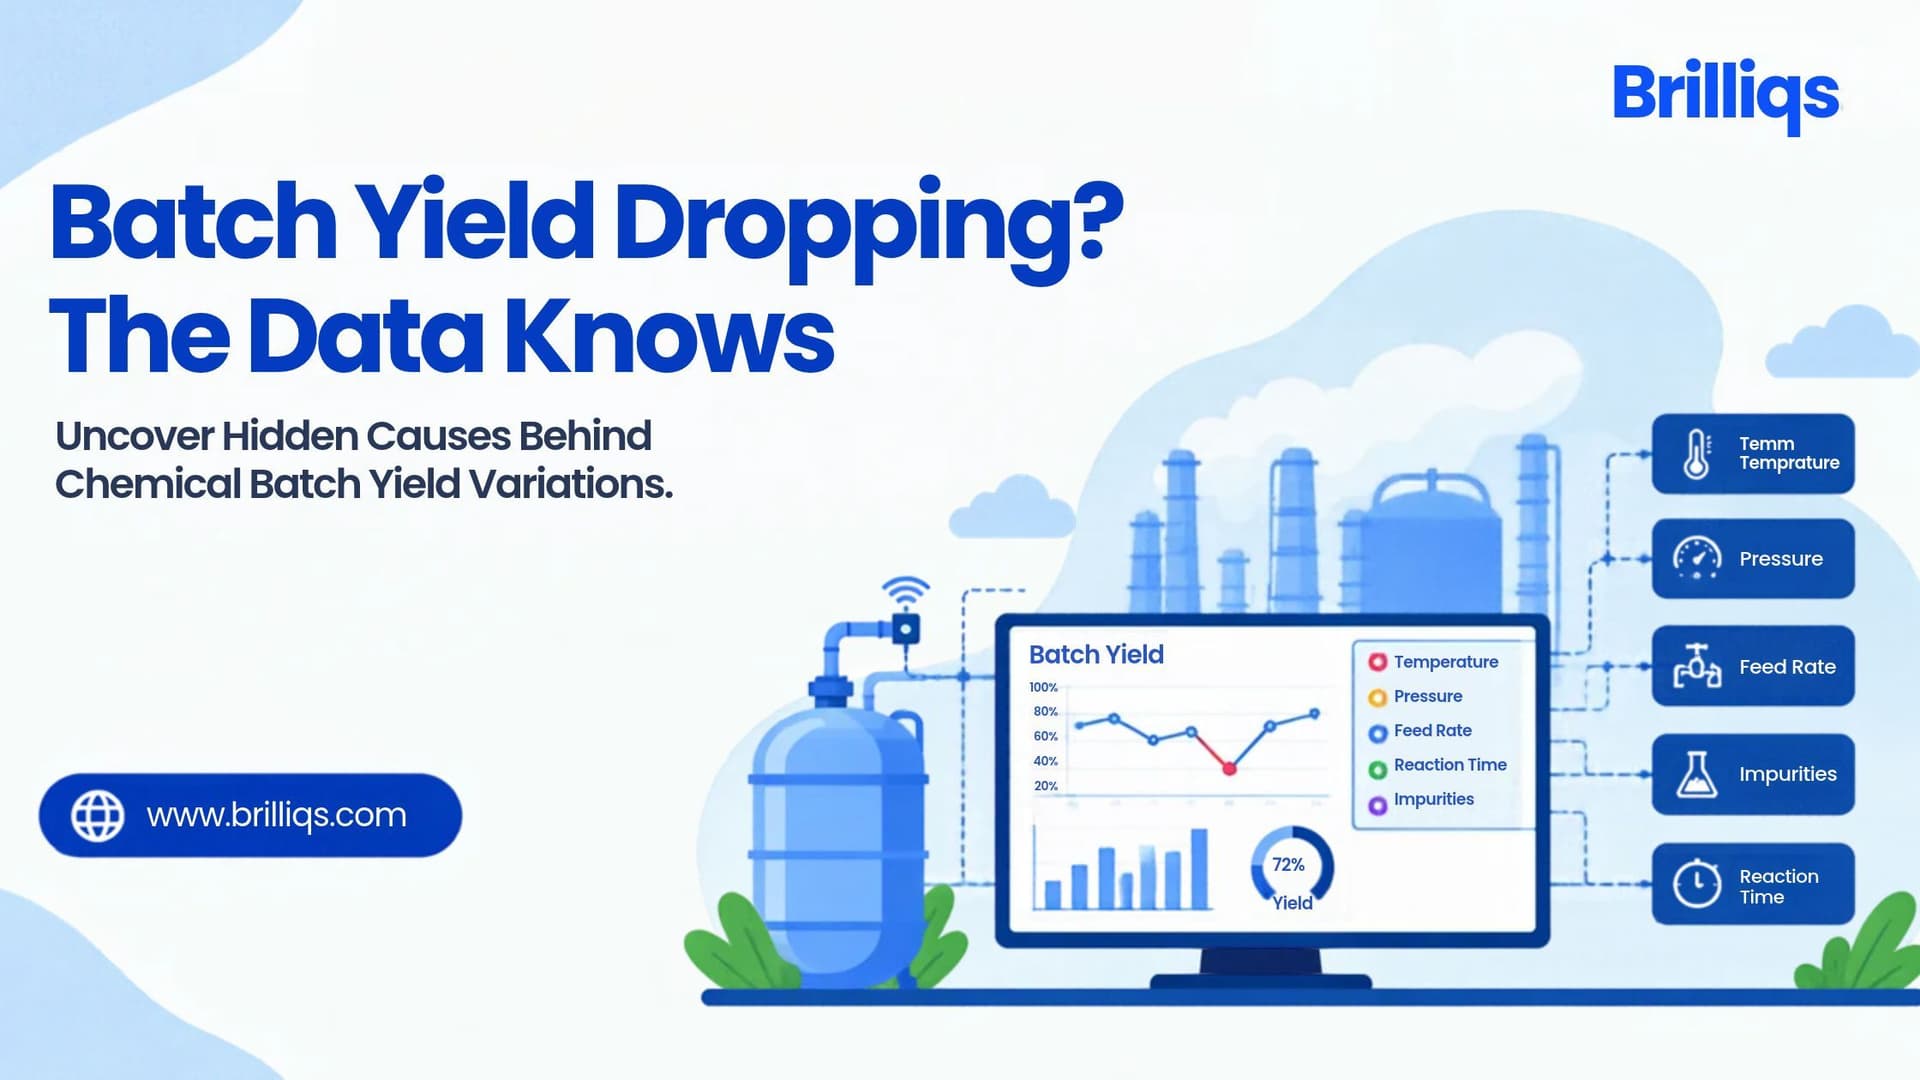
Why Is Your Chemical Batch Losing Yield? The Data Knows
Discover six factors behind chemical batch yield variation and how connected manufacturing data helps identify process inefficiencies and improve production visibility.
In chemical manufacturing, producing the same product twice does not always mean getting exactly the same output.
A batch may deliver the expected quantity, while the next batch produces slightly less despite following the same manufacturing procedure. Raw materials may be similar, equipment settings may appear unchanged and operators may follow established process instructions. Yet the final yield can still vary.
For chemical manufacturers, even small differences in batch yield can affect raw material consumption, production costs, waste generation and overall plant performance.
The first reaction is often to investigate the production process or review operator activities. However, the explanation may already exist in the data the plant collects every day.
Temperature variations, raw material characteristics, reaction duration, equipment performance and other operating conditions can all influence batch outcomes.
The challenge is identifying which factors matter, how they interact and whether the available data can reveal a consistent pattern.
Understanding batch yield variation starts with looking beyond the final production number and examining what happened throughout the process.
What Is Batch Yield in Chemical Manufacturing?
Batch yield measures the quantity of usable product obtained from a manufacturing batch relative to an expected or theoretical quantity.
Depending on the process, manufacturers may calculate yield using different reference points.
For example, actual product output can be compared with the theoretical output calculated from the chemical reaction or with an established standard for a particular product and process.
A simplified calculation is:
Batch Yield (%) = (Actual Product Output ÷ Expected Product Output) × 100
Suppose a chemical process is expected to produce 1,000 kg of finished product, but the actual output is 940 kg.
The batch yield against that expected output is 94%.
However, the percentage alone does not explain why the remaining 60 kg was not produced as expected.
Possible explanations include incomplete conversion, material losses, side reactions, processing inefficiencies or differences in measurement and accounting.
The objective is to identify the cause rather than simply report the final percentage.
1. Raw Material Variations Can Affect the Final Yield
The manufacturing process begins with the materials entering the plant.
Even when materials have the same product name, differences in purity, moisture content, concentration or other characteristics can influence process performance.
For example, a raw material with a slightly different concentration may change the effective quantity of the active component entering a reaction.
If the process recipe and material calculations do not account for that difference, the resulting batch may behave differently from previous batches.
What Data Should You Check?
Review the following information:
- Raw material batch numbers and supplier details
- Material purity and concentration
- Moisture content where relevant
- Actual material quantities issued
- Laboratory test results
- Material consumption records
Comparing this information across high yield and low yield batches can help identify whether material characteristics are associated with yield variation.
However, correlation alone does not prove that a particular material caused the difference. Process conditions and other variables must also be considered.
2. Temperature and Pressure Fluctuations May Reveal Process Instability
Chemical reactions often depend on operating conditions such as temperature and pressure.
When these parameters move outside their intended operating ranges, they can influence reaction rates, product formation, selectivity or process stability.
For example, a temperature deviation during a critical reaction stage may affect the formation of the desired product or increase the likelihood of unwanted reactions.
The final batch record may show a lower yield, but the explanation could be hidden in the process history.
What Data Should You Check?
Review process historian and control system records for:
- Temperature trends during each reaction stage
- Pressure variations
- Heating and cooling duration
- Agitation speed
- Flow rates
- Alarm history
- Time spent outside approved operating ranges
Comparing these trends across batches can help determine whether yield changes coincide with particular process deviations.
The analysis should consider the timing and duration of deviations, not just the final recorded temperature or pressure.
3. Reaction Time Can Influence Product Formation
Reaction duration is another important factor in chemical manufacturing.
Some processes require specific reaction times to achieve the desired conversion or product characteristics. Other processes may be affected by excessive reaction time or changes in reaction conditions.
A batch that reaches its intended endpoint too early may not achieve the required conversion. Extending the process unnecessarily may also affect throughput and depending on the chemistry product quality or selectivity.
However, the correct reaction time depends on the specific chemical process and validated operating procedure.
What Data Should You Check?
Compare:
- Batch start and end times
- Duration of individual processing stages
- Reaction endpoint measurements
- Operator interventions
- Temperature and pressure trends
- Differences between planned and actual processing time
If lower yield batches consistently show differences in reaction duration or endpoint conditions, further investigation may reveal an opportunity to improve process consistency.
4. Equipment Performance Can Create Hidden Differences
Chemical plants rely on reactors, pumps, agitators, heat exchangers, filters and other equipment to maintain consistent processing conditions.
Equipment may appear operational while performing differently from its expected condition.
For example, changes in agitation performance or heat transfer efficiency may influence mixing and temperature control. A filter operating below its expected performance may also affect product recovery.
These differences are not always obvious from a production summary.
What Data Should You Check?
Examine:
- Equipment operating history
- Maintenance and breakdown records
- Agitator speed and motor readings
- Heating and cooling performance
- Pump operating conditions
- Filter performance and product recovery
- Equipment cleaning and inspection records
Comparing equipment related data with batch yield can help identify recurring patterns.
Connecting maintenance records with production data is especially useful when several batches show lower yields around the same equipment or operating period.
5. Material Losses During Processing May Go Unnoticed
Not all yield losses originate during the chemical reaction itself.
Material can also be lost during transfer, filtration, separation, drying, discharge or equipment cleaning.
For example, product retained in pipelines, filters, or processing vessels may reduce the quantity recovered at the end of a batch.
If these losses are not measured consistently, manufacturers may struggle to distinguish between reaction inefficiency and downstream recovery problems.
What Data Should You Check?
Review:
- Material input and output quantities
- Intermediate product measurements
- Transfer and filtration records
- Equipment hold up estimates
- Recovered material quantities
- Waste and by product records
- Cleaning and discharge procedures
A stage by stage material balance can help identify where the difference between expected and actual output develops.
It is important to account for relevant streams including by products, recycled materials and process losses where applicable.
6. Manual Recording and Measurement Errors Can Distort Yield Calculations
Sometimes, apparent yield variation reflects inconsistent measurements or incomplete records rather than a genuine change in process performance.
A weighing instrument may require calibration. Material quantities may be entered manually, timestamps may be inconsistent or different teams may use different calculation methods.
Even small recording differences can complicate comparisons between batches.
What Data Should You Check?
Investigate:
- Weighing instrument calibration records
- Manual entries and corrections
- Missing or duplicated readings
- Batch record completeness
- Measurement units
- Yield calculation methods
- Differences between production and inventory records
Standardizing measurement practices and validating data before analysis helps manufacturers distinguish genuine process variation from reporting inconsistencies.
Why Batch Yield Analysis Often Falls Short
Many chemical plants already collect extensive process information. The difficulty is that this information is distributed across different systems.
Production records may be maintained in a Manufacturing Execution System (MES). Process parameters may be stored in a historian. Laboratory results may reside in a Laboratory Information Management System (LIMS) and equipment history may be recorded in a maintenance application.
When these systems are disconnected, investigating a low yield batch can require manually collecting and matching records.
This creates several challenges:
- Different systems may use different batch identifiers.
- Process readings and laboratory results may have different timestamps.
- Material quantities may be recorded in different units.
- Historical records may be incomplete.
- Teams may compare batches without accounting for relevant operating differences.
As a result, analysis may stop at reporting that yield has decreased instead of explaining what contributed to the change.
How Your Existing Process Data Can Reveal Yield Patterns
Manufacturers do not always need additional sensors to begin improving yield analysis. In many cases, the first step is to organize and examine the data they already collect.
1. Compare High Yield and Low Yield Batches
Start by identifying batches with consistently higher and lower yields.
Compare their raw material characteristics, processing conditions, reaction duration, equipment history and quality results.
This can help narrow the investigation to variables that deserve closer attention.
2. Analyze Process Trends Over Time
A batch level average may hide important variations.
Reviewing time series data can reveal whether temperature fluctuations, pressure changes or other deviations occurred during critical stages of the process.
The timing of a deviation may be more informative than the final recorded value.
3. Connect Production and Quality Records
Link batch production records with laboratory results and material information.
This creates a more complete view of the relationship between raw materials, operating conditions and finished product characteristics.
4. Establish Consistent Yield Metrics
Ensure that teams use clearly defined calculation methods and comparable reference quantities.
Manufacturers should distinguish between theoretical yield, actual yield, and recovery yield where these measures serve different purposes.
Consistent definitions make comparisons more meaningful.
5. Investigate Relationships Before Drawing Conclusions
Data analysis can reveal patterns but a pattern does not automatically establish causation.
For example, lower yields may coincide with longer reaction times because operators extend processing when a batch is already performing poorly.
In that case, reaction duration may be a response to the problem rather than its original cause.
Process expertise, sound experimental methods and appropriate statistical analysis are essential for validating potential explanations.
How Data Engineering Helps Improve Batch Yield Visibility
Data engineering helps bring information from production systems, process historians, laboratory applications, maintenance platforms and ERP systems into a consistent analytical environment.
This makes it easier to compare batches and investigate potential causes of yield variation.
A structured approach can include:
Data Integration: Connect relevant production, quality, material and equipment records.
Data Quality: Identify missing values, inconsistent units, duplicate records and unreliable measurements.
Automated Data Pipelines: Reduce repetitive manual work involved in collecting and preparing batch information.
Manufacturing Analytics: Compare batch performance and investigate relationships between operating conditions and yield.
Dashboards and Reporting: Present yield trends, batch comparisons and relevant process indicators in an accessible format.
Learn more about Data Engineering and how connected manufacturing data can support better operational visibility.
Once the data foundation is reliable, manufacturers can explore more advanced statistical methods and machine learning applications where suitable.
These methods may help identify complex relationships or support early warnings but their effectiveness depends on data quality, process understanding and sufficient historical examples.
What We Observed in Chemical Plants and How Data Helps
Understanding manufacturing challenges requires looking beyond reports and numbers. It starts with observing how processes actually work on the plant floor.
During chemical plant visits, we noticed recurring challenges such as variations in batch yield, disconnected production and quality records, manual reporting, and limited visibility into process performance.
These observations highlighted an important gap: plants were collecting valuable operational data, but teams were struggling to connect it and use it effectively.
To address these challenges, we developed data driven approaches focused on:
- Connected Plant Data: Bringing production, quality, inventory and maintenance information together.
- Automated Data Pipelines: Reducing manual data collection and repetitive reporting.
- Better Data Quality: Improving consistency and reliability across different systems.
- Manufacturing Analytics: Helping teams compare batch performance and identify patterns behind yield variations.
- Performance Dashboards: Providing clearer visibility into production trends and operational KPIs.
The Business Impact
With connected and reliable data, chemical manufacturers can reduce time spent collecting reports, investigate yield variations more effectively, identify operational inefficiencies and make better informed production decisions.
The focus is not simply on collecting more data, but on making existing plant data useful for solving real manufacturing problems.
Conclusion
Batch yield variation can result from several factors, including raw material characteristics, process conditions, equipment performance, material recovery and measurement practices.
The challenge is determining which factors are influencing a particular process and understanding how they interact.
Chemical plants already collect much of the information needed to begin this investigation. The opportunity lies in connecting that information, maintaining consistent data quality and analyzing batch performance in context.
Every batch tells a story. The right process data can help manufacturers understand it.
With a reliable data engineering foundation, chemical manufacturers can move beyond tracking yield percentages toward a more informed understanding of production performance.